Interpret the fulfilment, payment, category, customer, product and ingredient-demand sections available in Business Intelligence → Sales Analytics.
Continue through Sales Analytics
Below the headline Sales Analytics metrics and trend, the page provides additional Business Intelligence views for fulfilment, payments, categories, customers, products and demand. These sections use the currently selected Sales Analytics period.
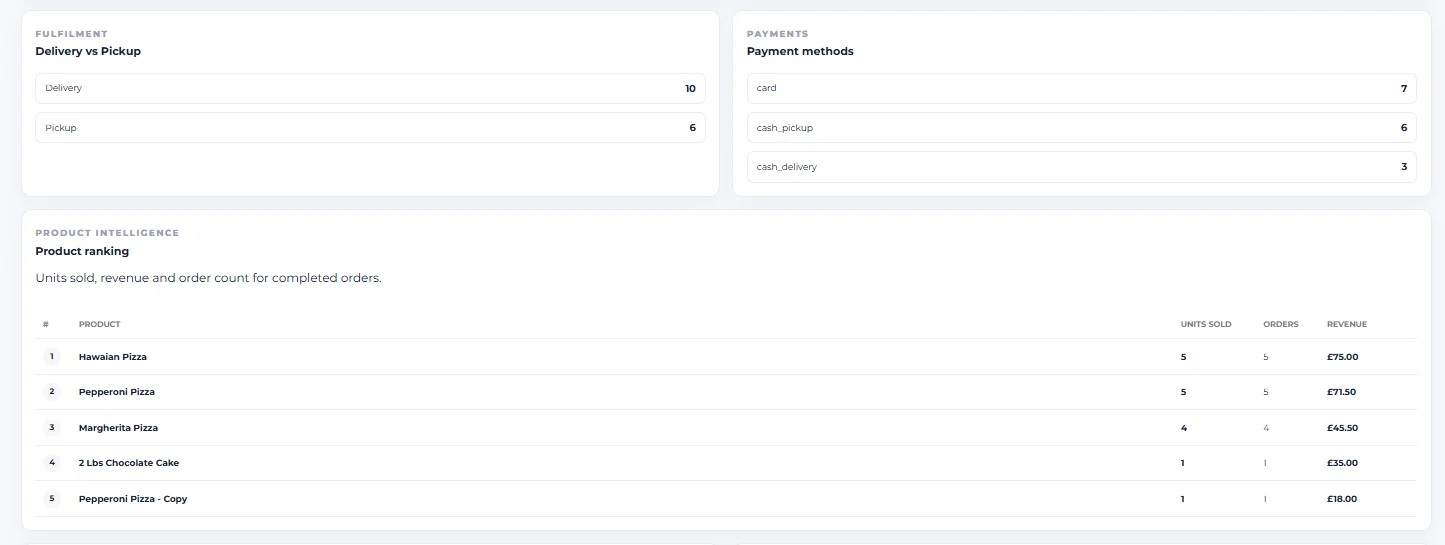
Compare Delivery vs Pickup
The Fulfilment section contains Delivery vs Pickup. It shows the number of orders associated with each fulfilment method, allowing you to compare delivery and pickup activity in the selected period.
Review payment methods
The Payments section lists the payment methods represented in the selected-period orders together with their order counts. The captured screen includes card, cash_pickup and cash_delivery.
Understand Product ranking
The Product Intelligence section contains Product ranking. The screen describes this as Units sold, revenue and order count for completed orders.
Each ranked product shows:
- Units sold
- Orders
- Revenue
Review Category performance
The Category Intelligence section ranks category performance. The captured view shows category-level units, orders and revenue, helping you compare how menu categories contributed during the selected period.
Understand Customer revenue
The Customer Intelligence section breaks customer revenue into New customers, Returning customers and VIP customers. Each segment displays customer count, revenue and its displayed share of customer revenue.
Review Top customers
The Customer Value section contains Top customers, described as Period spend, order activity and average spend. The table includes:
- Customer ranking
- Customer
- Segment
- Orders
- Average spend
- Period spend
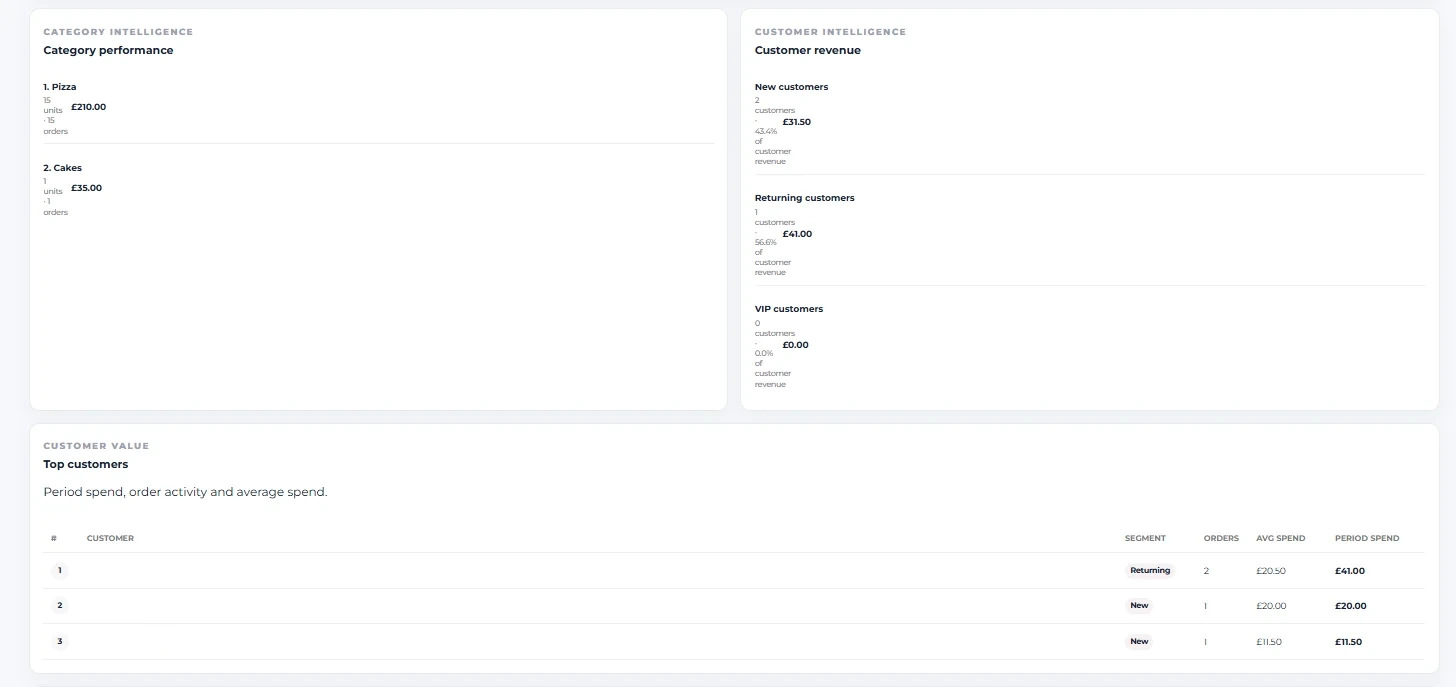
Customer revenue summarizes New, Returning and VIP customer segments, while Top customers focuses on individual period spend, order activity and average spend.
Understand Ingredient demand
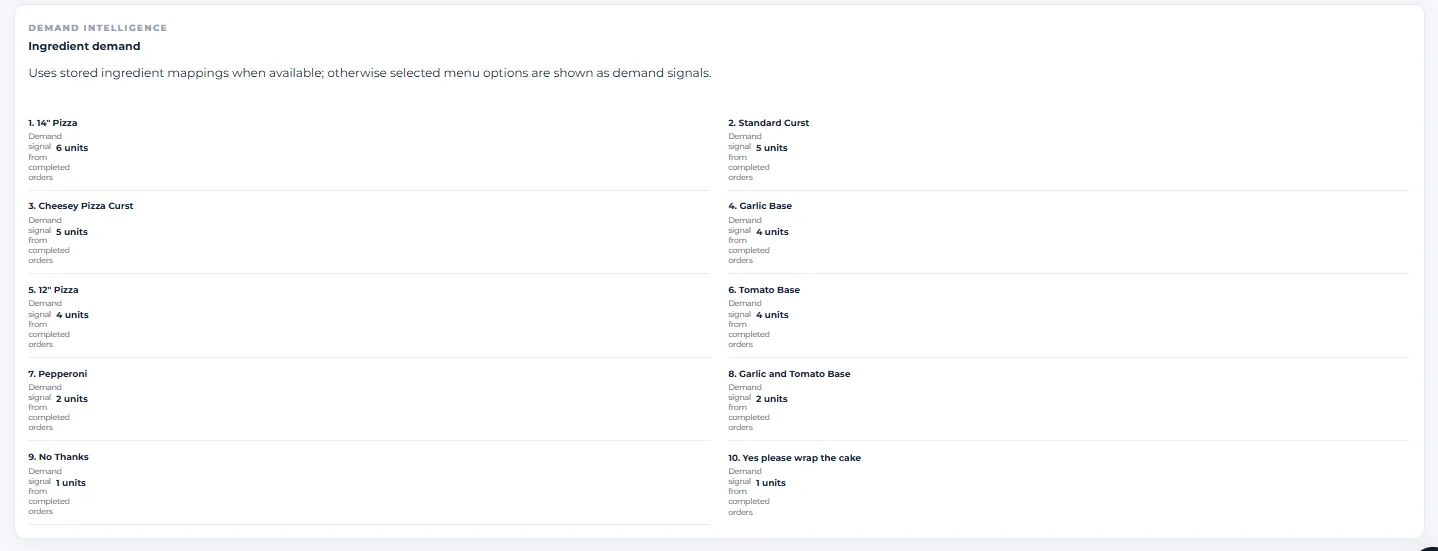
The Demand Intelligence section contains Ingredient demand. The screen explains that it uses stored ingredient mappings when available; otherwise selected menu options are shown as demand signals.
Read demand signals carefully
Each ranked demand entry shows a Demand signal measured from completed orders. Because the screen can fall back to selected menu options when stored ingredient mappings are unavailable, not every demand entry should automatically be interpreted as a configured inventory ingredient.
These Business Intelligence sections belong to Sales Analytics. Interpret fulfilment, payment, category, customer, product and demand results in the context of the period selected at the top of Sales Analytics.
You can now interpret the detailed Business Intelligence sections for fulfilment, payments, category performance, customer revenue, top customers, product ranking and ingredient demand.