
Use Sales Analytics to review sales, order volume, average order value, completed sales and the sales-and-order trend for a selected period.
Open Sales Analytics
From the restaurant dashboard, open Analytics. The Sales Analytics screen uses live order data to help you understand sales and order activity.
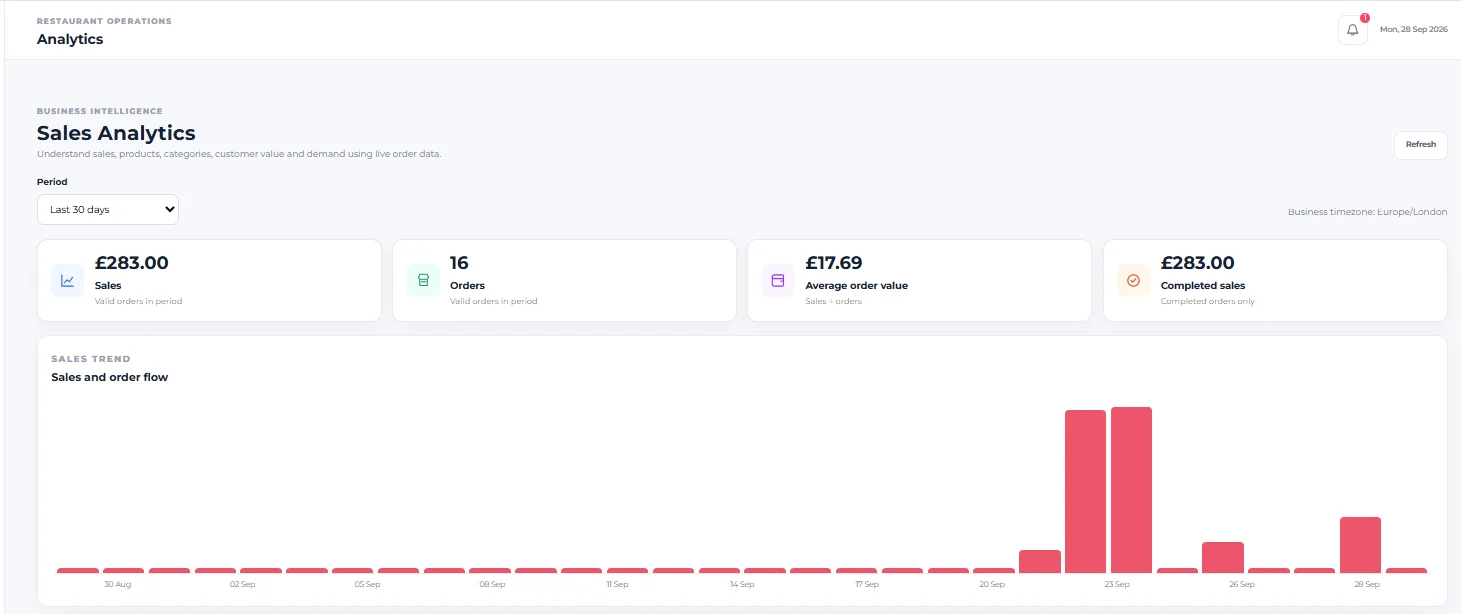
Choose the reporting period
Use the Period selector to choose the reporting window you want to review. The captured screen is displaying Last 30 days.
Refresh the analytics
Select Refresh when you want to reload the analytics information for the selected period.
Check the business timezone
The page displays the Business timezone used for the analytics view. In the captured example it is Europe/London.
Understand Sales
Sales shows sales from valid orders in the period. Use this card for the headline sales value associated with the selected reporting period.
Understand Orders
Orders shows the number of valid orders in the period.
Understand Average order value
Average order value is described on the screen as Sales ÷ orders. It provides the average sales value per valid order for the selected period.
Understand Completed sales
Completed sales shows sales from completed orders only. This lets you distinguish the completed-order sales figure from the broader Sales metric shown on the page.
The screen explicitly distinguishes valid orders in period from completed orders only. Use the label beneath each KPI when interpreting the displayed value.
Read Sales and order flow
The Sales Trend section contains Sales and order flow, giving you a date-based visual view of activity across the selected reporting period. Use it to identify when order activity is concentrated within that period.
Change the period when comparing activity
When you want a different reporting window, change Period and review the KPI cards and Sales and order flow again. The displayed analytics should always be interpreted in the context of the selected period and business timezone.
You can now use Sales Analytics to review period-based sales, valid order volume, average order value, completed sales and the sales-and-order activity view.